14  Enrichment Circlize

Tip

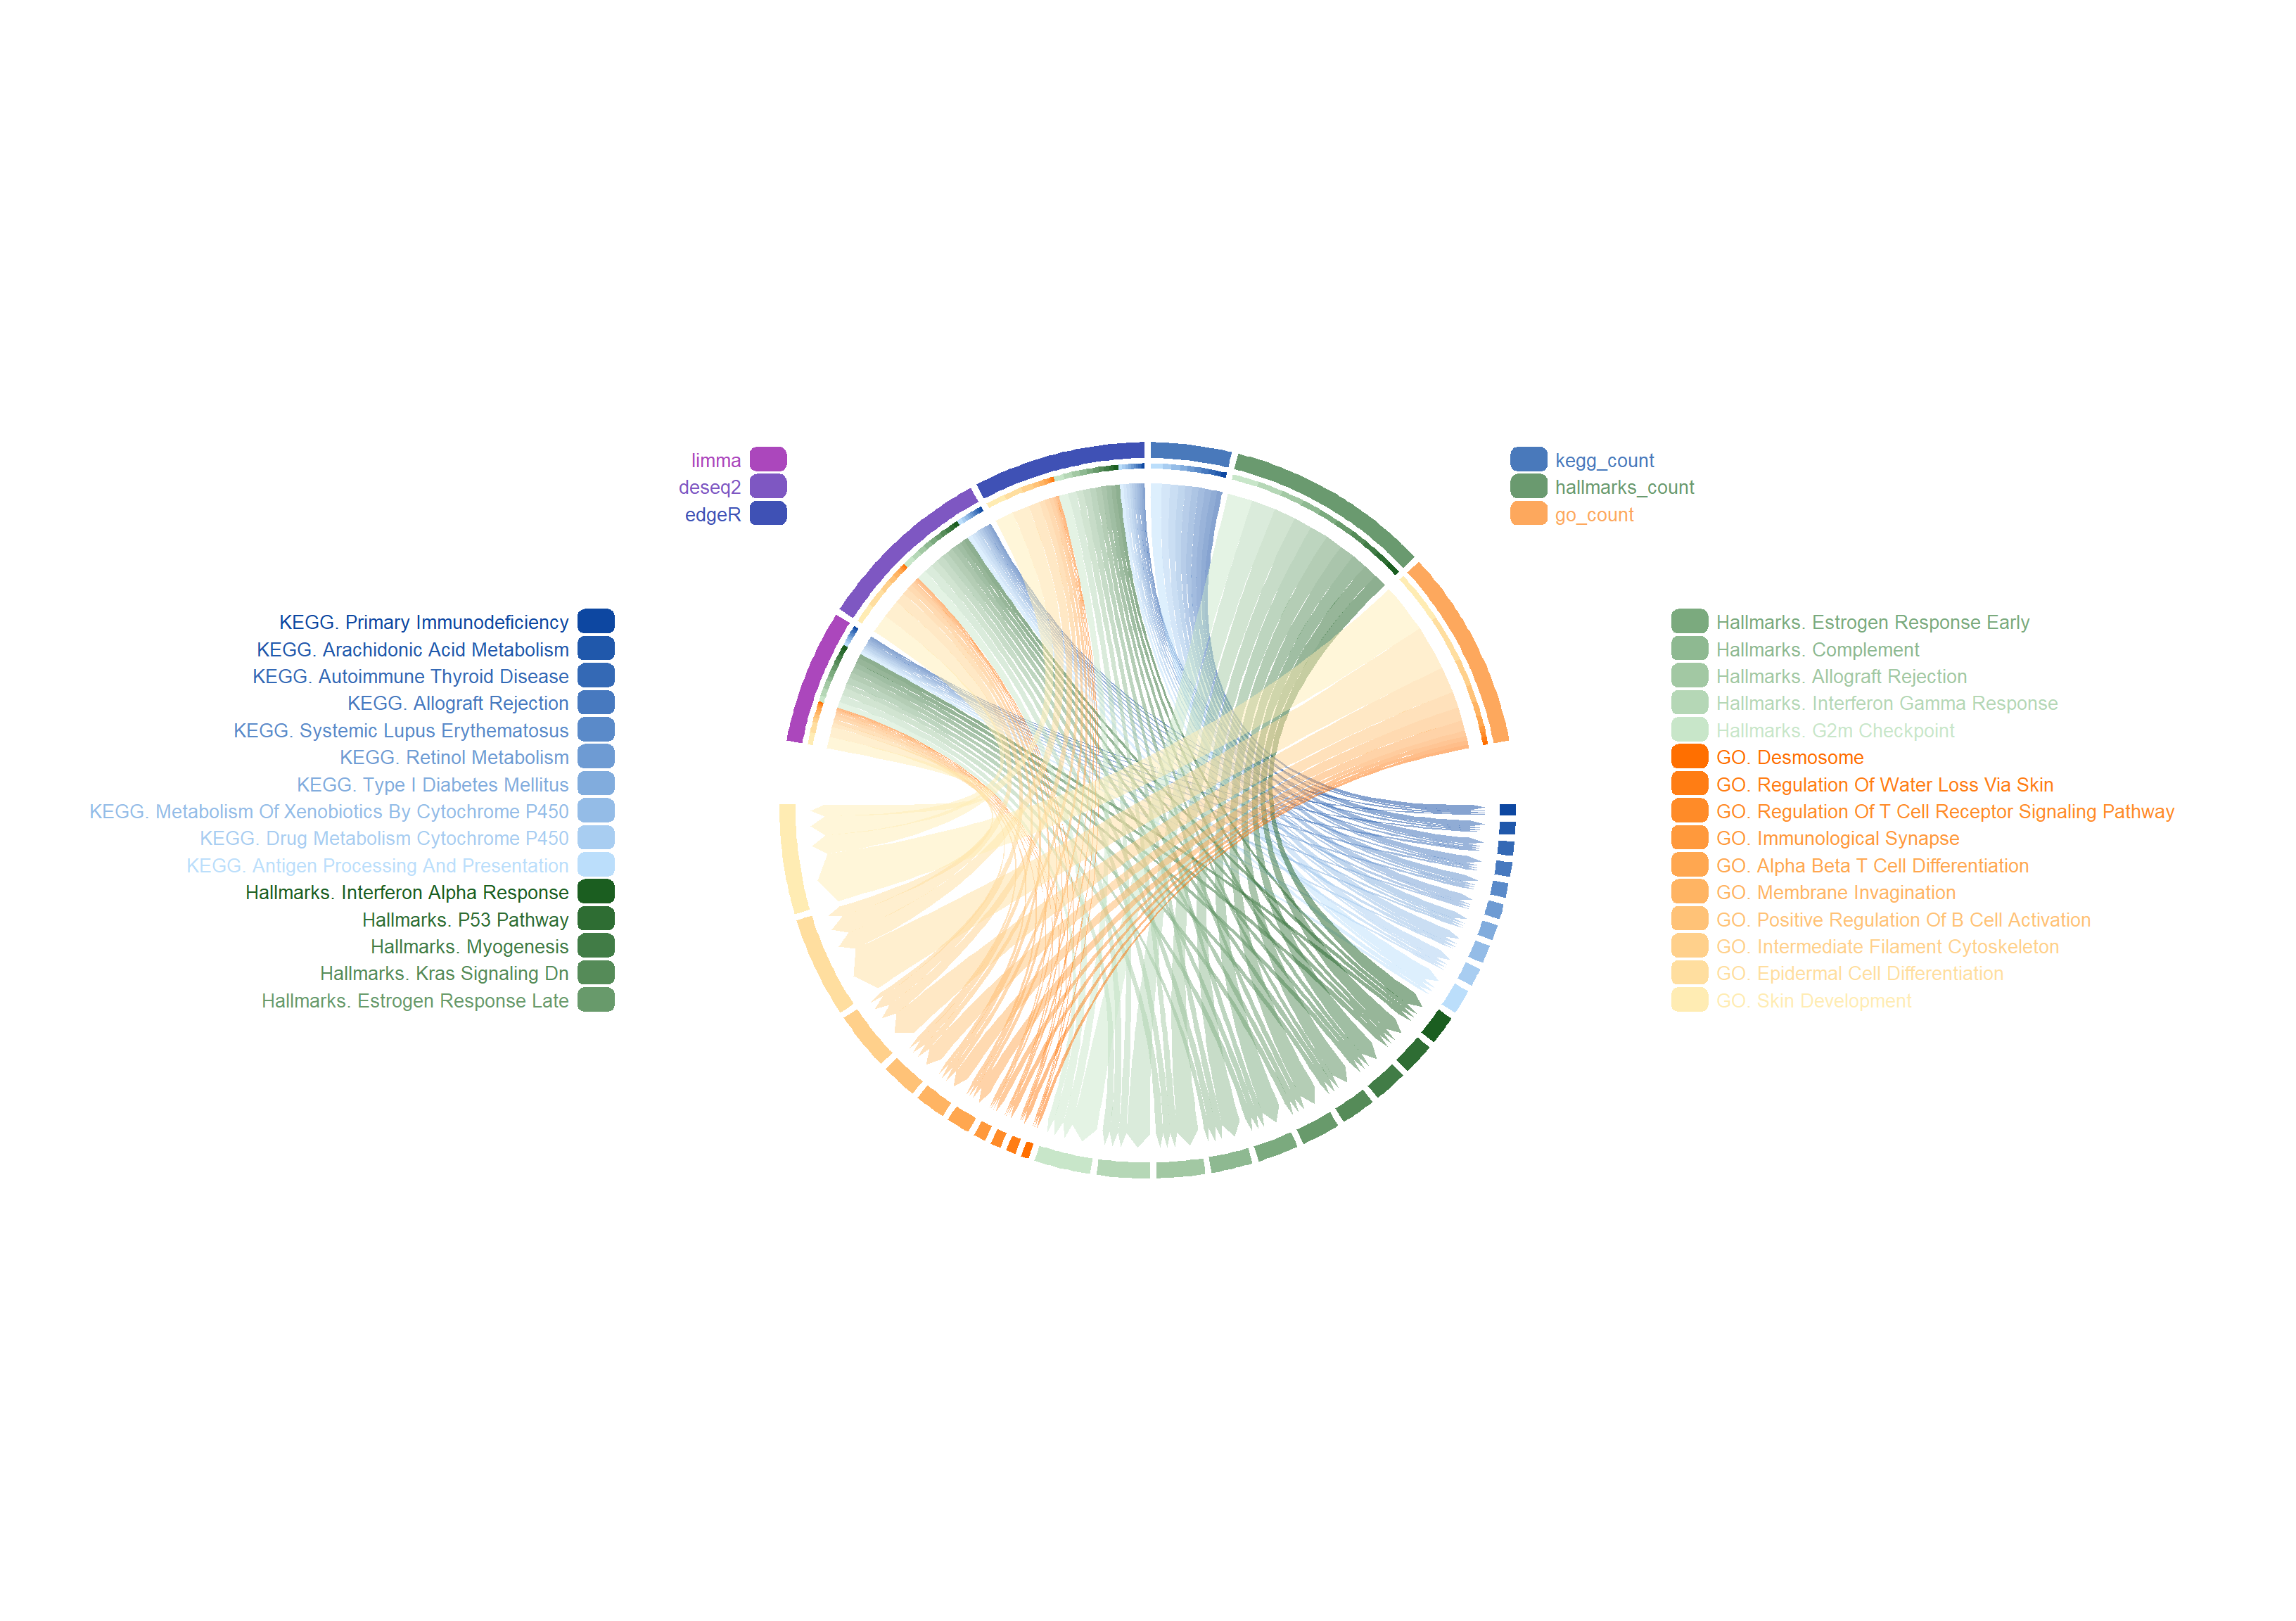
Integrated visualization of different samples, methods, and pathways: Includes specific naming annotations, sorting by the number of enriched genes, and unique arrangement without grouping.

library(TransProR)
library(clusterProfiler)
library(readr)
library(GSVA)
library(fgsea)
library(stringr)
library(dplyr)
library(tidyr)

14.1 geneList

DEG_deseq2 <- readRDS('../test_TransProR/Select DEGs/DEG_deseq2.Rdata')
DEG_edgeR <- readRDS('../test_TransProR/Select DEGs/DEG_edgeR.Rdata')
DEG_limma_voom <- readRDS('../test_TransProR/Select DEGs/DEG_limma_voom.Rdata')
Wilcoxon_rank_sum_testoutRst <- readRDS('../test_TransProR/Select DEGs/Wilcoxon_rank_sum_testoutRst.Rdata')


DEG_deseq2_geneList <- DEG_deseq2$log2FoldChange
names(DEG_deseq2_geneList) = row.names(DEG_deseq2)
DEG_deseq2_geneList = sort(DEG_deseq2_geneList, decreasing = TRUE)
head(DEG_deseq2_geneList)
     HTN3 LINC01502     MT-TP      HTN1    MAGEA4  MTRNR2L1 
 13.30557  13.26522  13.22724  12.69964  12.46226  12.42012 
DEG_edgeR_geneList <- DEG_edgeR$logFC
names(DEG_edgeR_geneList) = row.names(DEG_edgeR)
DEG_edgeR_geneList = sort(DEG_edgeR_geneList, decreasing = TRUE)
head(DEG_edgeR_geneList)
    HTN3    MT-TP   RN7SL2     HTN1    BANCR   MAGEA4 
14.33849 14.29320 12.44780 12.30199 12.05221 11.96610 
DEG_limma_voom_geneList <- DEG_limma_voom$logFC
names(DEG_limma_voom_geneList) = row.names(DEG_limma_voom)
DEG_limma_voom_geneList = sort(DEG_limma_voom_geneList, decreasing = TRUE)
head(DEG_limma_voom_geneList)
        PRAME         MT-TP RP11-599J14.2        RN7SL2    LHFPL3-AS1 
    11.897366     10.952225      9.753235      9.524066      9.006715 
         SPP1 
     8.678482 
Wilcoxon_rank_sum_testoutRst_geneList <- Wilcoxon_rank_sum_testoutRst$log2foldChange
names(Wilcoxon_rank_sum_testoutRst_geneList) = row.names(Wilcoxon_rank_sum_testoutRst)
Wilcoxon_rank_sum_testoutRst_geneList = sort(Wilcoxon_rank_sum_testoutRst_geneList, decreasing = TRUE)
head(Wilcoxon_rank_sum_testoutRst_geneList)
   MT-TP    BANCR   RN7SL2    PRAME    IGHGP   MAGEA3 
13.52891 11.68135 11.67955 11.32951 11.00800 10.93607 

14.2 symbols.gmt

hallmarks_pathways <- gmtPathways("../gmt/h.all.v7.4.symbols.gmt")
go_pathways <- gmtPathways("../gmt/c5.go.v7.4.symbols.gmt")
kegg_pathways <- gmtPathways("../gmt/c2.cp.kegg.v7.4.symbols.gmt")

14.3 fgsea:hallmarks/go/kegg

14.3.1 deseq2

set.seed(11)
deseq2_hallmarks_fgseaRes <- fgsea(hallmarks_pathways, DEG_deseq2_geneList, minSize=15, maxSize=500, nperm = 10000)

### Calculate genecount

deseq2_hallmarks_fgseaRes$leadingEdge <- as.character(deseq2_hallmarks_fgseaRes$leadingEdge)
deseq2_hallmarks_fgseaRes$genecount <- NA  # Initialize new column

for(i in 1:nrow(deseq2_hallmarks_fgseaRes)){
  print(i)
  term = deseq2_hallmarks_fgseaRes$leadingEdge[i]
  # 1. Split
  term_split = unlist(strsplit(term, split=",", fixed=TRUE))
  # Add gene count calculation
  deseq2_hallmarks_fgseaRes$genecount[i] = length(term_split)
}

set.seed(12)
deseq2_go_fgseaRes <- fgsea(go_pathways, DEG_deseq2_geneList, minSize=15, maxSize=500, nperm = 10000)

### Calculate genecount

deseq2_go_fgseaRes$leadingEdge <- as.character(deseq2_go_fgseaRes$leadingEdge)
deseq2_go_fgseaRes$genecount <- NA  # Initialize new column

for(i in 1:nrow(deseq2_go_fgseaRes)){
  print(i)
  term = deseq2_go_fgseaRes$leadingEdge[i]
  # 1. Split
  term_split = unlist(strsplit(term, split=",", fixed=TRUE))
  # Add gene count calculation
  deseq2_go_fgseaRes$genecount[i] = length(term_split)
}

set.seed(13)
deseq2_kegg_fgseaRes <- fgsea(kegg_pathways, DEG_deseq2_geneList, minSize=15, maxSize=500, nperm = 10000)

### Calculate genecount

deseq2_kegg_fgseaRes$leadingEdge <- as.character(deseq2_kegg_fgseaRes$leadingEdge)
deseq2_kegg_fgseaRes$genecount <- NA  # Initialize new column

for(i in 1:nrow(deseq2_kegg_fgseaRes)){
  print(i)
  term = deseq2_kegg_fgseaRes$leadingEdge[i]
  # 1. Split
  term_split = unlist(strsplit(term, split=",", fixed=TRUE))
  # Add gene count calculation
  deseq2_kegg_fgseaRes$genecount[i] = length(term_split)
}

14.3.2 edgeR

set.seed(21)
edgeR_hallmarks_fgseaRes <- fgsea(hallmarks_pathways, DEG_edgeR_geneList, minSize=15, maxSize=500, nperm = 10000)

### Calculate genecount

edgeR_hallmarks_fgseaRes$leadingEdge <- as.character(edgeR_hallmarks_fgseaRes$leadingEdge)
edgeR_hallmarks_fgseaRes$genecount <- NA  # Initialize new column

for(i in 1:nrow(edgeR_hallmarks_fgseaRes)){
  print(i)
  term = edgeR_hallmarks_fgseaRes$leadingEdge[i]
  # 1. Split
  term_split = unlist(strsplit(term, split=",", fixed=TRUE))
  # Add gene count calculation
  edgeR_hallmarks_fgseaRes$genecount[i] = length(term_split)
}

set.seed(22)
edgeR_go_fgseaRes <- fgsea(go_pathways, DEG_edgeR_geneList, minSize=15, maxSize=500, nperm = 10000)

### Calculate genecount

edgeR_go_fgseaRes$leadingEdge <- as.character(edgeR_go_fgseaRes$leadingEdge)
edgeR_go_fgseaRes$genecount <- NA  # Initialize new column

for(i in 1:nrow(edgeR_go_fgseaRes)){
  print(i)
  term = edgeR_go_fgseaRes$leadingEdge[i]
  # 1. Split
  term_split = unlist(strsplit(term, split=",", fixed=TRUE))
  # Add gene count calculation
  edgeR_go_fgseaRes$genecount[i] = length(term_split)
}

set.seed(23)
edgeR_kegg_fgseaRes <- fgsea(kegg_pathways, DEG_edgeR_geneList, minSize=15, maxSize=500, nperm = 10000)

### Calculate genecount

edgeR_kegg_fgseaRes$leadingEdge <- as.character(edgeR_kegg_fgseaRes$leadingEdge)
edgeR_kegg_fgseaRes$genecount <- NA  # Initialize new column

for(i in 1:nrow(edgeR_kegg_fgseaRes)){
  print(i)
  term = edgeR_kegg_fgseaRes$leadingEdge[i]
  # 1. Split
  term_split = unlist(strsplit(term, split=",", fixed=TRUE))
  # Add gene count calculation
  edgeR_kegg_fgseaRes$genecount[i] = length(term_split)
}

14.3.3 limma

set.seed(31)
limma_hallmarks_fgseaRes <- fgsea(hallmarks_pathways, DEG_limma_voom_geneList, minSize=15, maxSize=500, nperm = 10000)

### Calculate genecount

limma_hallmarks_fgseaRes$leadingEdge <- as.character(limma_hallmarks_fgseaRes$leadingEdge)
limma_hallmarks_fgseaRes$genecount <- NA  # Initialize new column

for(i in 1:nrow(limma_hallmarks_fgseaRes)){
  print(i)
  term = limma_hallmarks_fgseaRes$leadingEdge[i]
  # 1. Split
  term_split = unlist(strsplit(term, split=",", fixed=TRUE))
  # Add gene count calculation
  limma_hallmarks_fgseaRes$genecount[i] = length(term_split)
}

set.seed(32)
limma_go_fgseaRes <- fgsea(go_pathways, DEG_limma_voom_geneList, minSize=15, maxSize=500, nperm = 10000)

### Calculate genecount

limma_go_fgseaRes$leadingEdge <- as.character(limma_go_fgseaRes$leadingEdge)
limma_go_fgseaRes$genecount <- NA  # Initialize new column

for(i in 1:nrow(limma_go_fgseaRes)){
  print(i)
  term = limma_go_fgseaRes$leadingEdge[i]
  # 1. Split
  term_split = unlist(strsplit(term, split=",", fixed=TRUE))
  # Add gene count calculation
  limma_go_fgseaRes$genecount[i] = length(term_split)
}

set.seed(33)
limma_kegg_fgseaRes <- fgsea(kegg_pathways, DEG_limma_voom_geneList, minSize=15, maxSize=500, nperm = 10000)

### Calculate genecount

limma_kegg_fgseaRes$leadingEdge <- as.character(limma_kegg_fgseaRes$leadingEdge)
limma_kegg_fgseaRes$genecount <- NA  # Initialize new column

for(i in 1:nrow(limma_kegg_fgseaRes)){
  print(i)
  term = limma_kegg_fgseaRes$leadingEdge[i]
  # 1. Split
  term_split = unlist(strsplit(term, split=",", fixed=TRUE))
  # Add gene count calculation
  limma_kegg_fgseaRes$genecount[i] = length(term_split)
}

14.4 Adjustment

14.4.1 deseq2

result <- adjust_export_pathway(fgseaRes =deseq2_hallmarks_fgseaRes, nTop = 10)
deseq2_hallmarks_UpDown_topPathways <- result$combinedPathways
deseq2_hallmarks_fgseaRes <- result$fgseaRes
result <- adjust_export_pathway(fgseaRes =deseq2_go_fgseaRes, nTop = 100)
deseq2_go_UpDown_topPathways <- result$combinedPathways
deseq2_go_fgseaRes <- result$fgseaRes
result <- adjust_export_pathway(fgseaRes =deseq2_kegg_fgseaRes, nTop = 10)
deseq2_kegg_UpDown_topPathways <- result$combinedPathways
deseq2_kegg_fgseaRes <- result$fgseaRes

14.4.2 edgeR

result <- adjust_export_pathway(fgseaRes =edgeR_hallmarks_fgseaRes, nTop = 10)
edgeR_hallmarks_UpDown_topPathways <- result$combinedPathways
edgeR_hallmarks_fgseaRes <- result$fgseaRes
result <- adjust_export_pathway(fgseaRes =edgeR_go_fgseaRes, nTop = 100)
edgeR_go_UpDown_topPathways <- result$combinedPathways
edgeR_go_fgseaRes <- result$fgseaRes
result <- adjust_export_pathway(fgseaRes =edgeR_kegg_fgseaRes, nTop = 10)
edgeR_kegg_UpDown_topPathways <- result$combinedPathways
edgeR_kegg_fgseaRes <- result$fgseaRes

14.4.3 limma

result <- adjust_export_pathway(fgseaRes =limma_hallmarks_fgseaRes, nTop = 10)
limma_hallmarks_UpDown_topPathways <- result$combinedPathways
limma_hallmarks_fgseaRes <- result$fgseaRes
result <- adjust_export_pathway(fgseaRes =limma_go_fgseaRes, nTop = 100)
limma_go_UpDown_topPathways <- result$combinedPathways
limma_go_fgseaRes <- result$fgseaRes
result <- adjust_export_pathway(fgseaRes =limma_kegg_fgseaRes, nTop = 10)
limma_kegg_UpDown_topPathways <- result$combinedPathways
limma_kegg_fgseaRes <- result$fgseaRes

14.5 common_elements

# Use Reduce and intersect to calculate the intersection of all vectors
kegg_UpDown_common_elements <- Reduce(intersect, list(limma_kegg_UpDown_topPathways, 
                                                      edgeR_kegg_UpDown_topPathways, 
                                                      deseq2_kegg_UpDown_topPathways))
# Print the intersection results
print(kegg_UpDown_common_elements)
 [1] "Primary Immunodeficiency"                    
 [2] "Allograft Rejection"                         
 [3] "Graft Versus Host Disease"                   
 [4] "Autoimmune Thyroid Disease"                  
 [5] "Type I Diabetes Mellitus"                    
 [6] "Systemic Lupus Erythematosus"                
 [7] "Antigen Processing And Presentation"         
 [8] "Arachidonic Acid Metabolism"                 
 [9] "Metabolism Of Xenobiotics By Cytochrome P450"
[10] "Drug Metabolism Cytochrome P450"             
[11] "Retinol Metabolism"                          
# Use Reduce and intersect to calculate the intersection of all vectors
go_UpDown_common_elements <- Reduce(intersect, list(limma_go_UpDown_topPathways,
                                                    edgeR_go_UpDown_topPathways,
                                                    deseq2_go_UpDown_topPathways))
# Print the intersection results
print(go_UpDown_common_elements)
 [1] "Mhc Protein Complex"                                                                                
 [2] "Mhc Protein Complex Binding"                                                                        
 [3] "Peptide Antigen Binding"                                                                            
 [4] "Lumenal Side Of Endoplasmic Reticulum Membrane"                                                     
 [5] "Tolerance Induction"                                                                                
 [6] "T Cell Receptor Complex"                                                                            
 [7] "Positive Regulation Of Interleukin 2 Production"                                                    
 [8] "Immunoglobulin Complex Circulating"                                                                 
 [9] "Regulatory T Cell Differentiation"                                                                  
[10] "Lumenal Side Of Membrane"                                                                           
[11] "Immunoglobulin Receptor Binding"                                                                    
[12] "Positive T Cell Selection"                                                                          
[13] "Regulation Of Natural Killer Cell Mediated Immunity"                                                
[14] "T Cell Mediated Cytotoxicity"                                                                       
[15] "Regulation Of T Cell Receptor Signaling Pathway"                                                    
[16] "Immunological Synapse"                                                                              
[17] "Cellular Defense Response"                                                                          
[18] "T Cell Selection"                                                                                   
[19] "Phagocytosis Recognition"                                                                           
[20] "Negative Regulation Of Viral Genome Replication"                                                    
[21] "Positive Regulation Of Cell Killing"                                                                
[22] "Pigment Biosynthetic Process"                                                                       
[23] "Immunoglobulin Complex"                                                                             
[24] "Regulation Of B Cell Proliferation"                                                                 
[25] "Positive Regulation Of Alpha Beta T Cell Activation"                                                
[26] "Regulation Of Antigen Receptor Mediated Signaling Pathway"                                          
[27] "Regulation Of Complement Activation"                                                                
[28] "Positive Regulation Of Interferon Gamma Production"                                                 
[29] "Regulation Of Leukocyte Mediated Cytotoxicity"                                                      
[30] "Tertiary Granule Membrane"                                                                          
[31] "B Cell Proliferation"                                                                               
[32] "Regulation Of Cell Killing"                                                                         
[33] "Specific Granule Membrane"                                                                          
[34] "Humoral Immune Response Mediated By Circulating Immunoglobulin"                                     
[35] "Positive Regulation Of T Cell Proliferation"                                                        
[36] "B Cell Receptor Signaling Pathway"                                                                  
[37] "Antigen Binding"                                                                                    
[38] "Regulation Of Alpha Beta T Cell Activation"                                                         
[39] "Regulation Of Humoral Immune Response"                                                              
[40] "Complement Activation"                                                                              
[41] "Membrane Invagination"                                                                              
[42] "Positive Regulation Of B Cell Activation"                                                           
[43] "Alpha Beta T Cell Differentiation"                                                                  
[44] "Blood Microparticle"                                                                                
[45] "Positive Regulation Of Leukocyte Mediated Immunity"                                                 
[46] "Epithelial Cell Proliferation"                                                                      
[47] "Endopeptidase Activity"                                                                             
[48] "Fatty Acid Metabolic Process"                                                                       
[49] "Epidermis Development"                                                                              
[50] "Skin Development"                                                                                   
[51] "Epidermal Cell Differentiation"                                                                     
[52] "Contractile Fiber"                                                                                  
[53] "Fat Cell Differentiation"                                                                           
[54] "Keratinocyte Differentiation"                                                                       
[55] "Hormone Metabolic Process"                                                                          
[56] "Serine Hydrolase Activity"                                                                          
[57] "Intermediate Filament Cytoskeleton"                                                                 
[58] "Keratinization"                                                                                     
[59] "Response To Xenobiotic Stimulus"                                                                    
[60] "Intermediate Filament"                                                                              
[61] "Striated Muscle Cell Development"                                                                   
[62] "Primary Alcohol Metabolic Process"                                                                  
[63] "Cellular Component Assembly Involved In Morphogenesis"                                              
[64] "Skin Epidermis Development"                                                                         
[65] "Desmosome"                                                                                          
[66] "Regulation Of Water Loss Via Skin"                                                                  
[67] "Aromatase Activity"                                                                                 
[68] "Cell Cell Junction"                                                                                 
[69] "Regulation Of Systemic Arterial Blood Pressure"                                                     
[70] "Epithelial Cell Development"                                                                        
[71] "Oxidoreductase Activity Acting On Paired Donors With Incorporation Or Reduction Of Molecular Oxygen"
[72] "Lipid Catabolic Process"                                                                            
[73] "Cellular Modified Amino Acid Metabolic Process"                                                     
[74] "Heart Morphogenesis"                                                                                
[75] "Cell Cell Junction Organization"                                                                    
[76] "Cardiac Muscle Tissue Development"                                                                  
# Use Reduce and intersect to calculate the intersection of all vectors
hallmarks_UpDown_common_elements <- Reduce(intersect, list(limma_hallmarks_UpDown_topPathways,
                                                          edgeR_hallmarks_UpDown_topPathways,
                                                          deseq2_hallmarks_UpDown_topPathways))
# Print the intersection results
print(hallmarks_UpDown_common_elements)
 [1] "Interferon Alpha Response"         "Allograft Rejection"              
 [3] "Complement"                        "Inflammatory Response"            
 [5] "Interferon Gamma Response"         "G2m Checkpoint"                   
 [7] "E2f Targets"                       "Il6 Jak Stat3 Signaling"          
 [9] "Estrogen Response Early"           "Estrogen Response Late"           
[11] "Myogenesis"                        "Kras Signaling Dn"                
[13] "P53 Pathway"                       "Hypoxia"                          
[15] "Epithelial Mesenchymal Transition" "Apical Junction"                  
[17] "Xenobiotic Metabolism"            
# Randomly select 10 pathways from the provided list, ensuring that each pathway name does not exceed 10 words.
hallmarks_selected_pathways <- selectPathways(hallmarks_UpDown_common_elements, max_words = 10, num_select = 10)
print(hallmarks_selected_pathways)
 [1] "Complement"                "Estrogen Response Late"   
 [3] "Kras Signaling Dn"         "Allograft Rejection"      
 [5] "P53 Pathway"               "Myogenesis"               
 [7] "Interferon Gamma Response" "G2m Checkpoint"           
 [9] "Estrogen Response Early"   "Interferon Alpha Response"
go_selected_pathways <- selectPathways(go_UpDown_common_elements, max_words = 10, num_select = 10)
print(go_selected_pathways)
 [1] "Epidermal Cell Differentiation"                 
 [2] "Alpha Beta T Cell Differentiation"              
 [3] "Desmosome"                                      
 [4] "Membrane Invagination"                          
 [5] "Regulation Of Water Loss Via Skin"              
 [6] "Regulation Of T Cell Receptor Signaling Pathway"
 [7] "Positive Regulation Of B Cell Activation"       
 [8] "Immunological Synapse"                          
 [9] "Intermediate Filament Cytoskeleton"             
[10] "Skin Development"                               
kegg_selected_pathways <- selectPathways(kegg_UpDown_common_elements, max_words = 10, num_select = 10)
print(kegg_selected_pathways)
 [1] "Metabolism Of Xenobiotics By Cytochrome P450"
 [2] "Retinol Metabolism"                          
 [3] "Primary Immunodeficiency"                    
 [4] "Allograft Rejection"                         
 [5] "Type I Diabetes Mellitus"                    
 [6] "Autoimmune Thyroid Disease"                  
 [7] "Drug Metabolism Cytochrome P450"             
 [8] "Systemic Lupus Erythematosus"                
 [9] "Arachidonic Acid Metabolism"                 
[10] "Antigen Processing And Presentation"         

14.6 Merge data

14.6.1 Hallmarks

# Filter data
deseq2_hallmarks_filtered_fgseaRes <- deseq2_hallmarks_fgseaRes[deseq2_hallmarks_fgseaRes$pathway %in% hallmarks_selected_pathways, ]
# Select 'pathway' and 'genecount' columns
deseq2_hallmarks_filtered_10fgseaRes <- deseq2_hallmarks_filtered_fgseaRes[, c("pathway", "genecount")]
# Print results
print(deseq2_hallmarks_filtered_10fgseaRes)
                      pathway genecount
                       <char>     <int>
 1:            G2m Checkpoint       113
 2:   Estrogen Response Early        71
 3:    Estrogen Response Late        70
 4:                Myogenesis        56
 5: Interferon Alpha Response        53
 6: Interferon Gamma Response        99
 7:                Complement        81
 8:               P53 Pathway        52
 9:       Allograft Rejection        83
10:         Kras Signaling Dn        65
colnames(deseq2_hallmarks_filtered_10fgseaRes) <- c("pathway", "deseq2")

# Filter data
edgeR_hallmarks_filtered_fgseaRes <- edgeR_hallmarks_fgseaRes[edgeR_hallmarks_fgseaRes$pathway %in% hallmarks_selected_pathways, ]
# Select 'pathway' and 'genecount' columns
edgeR_hallmarks_filtered_10fgseaRes <- edgeR_hallmarks_filtered_fgseaRes[, c("pathway", "genecount")]
# Print results
print(edgeR_hallmarks_filtered_10fgseaRes)
                      pathway genecount
                       <char>     <int>
 1:            G2m Checkpoint       112
 2:   Estrogen Response Early        70
 3:    Estrogen Response Late        68
 4:                Myogenesis        59
 5: Interferon Alpha Response        50
 6: Interferon Gamma Response        95
 7:                Complement        79
 8:               P53 Pathway        52
 9:       Allograft Rejection        82
10:         Kras Signaling Dn        54
colnames(edgeR_hallmarks_filtered_10fgseaRes) <- c("pathway", "edgeR")

# Filter data
limma_hallmarks_filtered_fgseaRes <- limma_hallmarks_fgseaRes[limma_hallmarks_fgseaRes$pathway %in% hallmarks_selected_pathways, ]
# Select 'pathway' and 'genecount' columns
limma_hallmarks_filtered_10fgseaRes <- limma_hallmarks_filtered_fgseaRes[, c("pathway", "genecount")]
# Print results
print(limma_hallmarks_filtered_10fgseaRes)
                      pathway genecount
                       <char>     <int>
 1:            G2m Checkpoint        70
 2:   Estrogen Response Early        74
 3:    Estrogen Response Late        67
 4:                Myogenesis        62
 5: Interferon Alpha Response        52
 6: Interferon Gamma Response        86
 7:                Complement        56
 8:               P53 Pathway        61
 9:       Allograft Rejection        88
10:         Kras Signaling Dn        63
colnames(limma_hallmarks_filtered_10fgseaRes) <- c("pathway", "limma")

# Use full_join to merge dataframes
hallmarks_combined_df <- deseq2_hallmarks_filtered_10fgseaRes %>%
  full_join(edgeR_hallmarks_filtered_10fgseaRes, by = "pathway") %>%
  full_join(limma_hallmarks_filtered_10fgseaRes, by = "pathway")

# View the merged dataframe
print(hallmarks_combined_df)
                      pathway deseq2 edgeR limma
                       <char>  <int> <int> <int>
 1:            G2m Checkpoint    113   112    70
 2:   Estrogen Response Early     71    70    74
 3:    Estrogen Response Late     70    68    67
 4:                Myogenesis     56    59    62
 5: Interferon Alpha Response     53    50    52
 6: Interferon Gamma Response     99    95    86
 7:                Complement     81    79    56
 8:               P53 Pathway     52    52    61
 9:       Allograft Rejection     83    82    88
10:         Kras Signaling Dn     65    54    63
# Add a prefix "hallmarks." to the pathway column
hallmarks_combined_df <- hallmarks_combined_df %>%
  mutate(pathway = paste("Hallmarks.", pathway))

# Print the modified dataframe to view results
print(hallmarks_combined_df)
                                 pathway deseq2 edgeR limma
                                  <char>  <int> <int> <int>
 1:            Hallmarks. G2m Checkpoint    113   112    70
 2:   Hallmarks. Estrogen Response Early     71    70    74
 3:    Hallmarks. Estrogen Response Late     70    68    67
 4:                Hallmarks. Myogenesis     56    59    62
 5: Hallmarks. Interferon Alpha Response     53    50    52
 6: Hallmarks. Interferon Gamma Response     99    95    86
 7:                Hallmarks. Complement     81    79    56
 8:               Hallmarks. P53 Pathway     52    52    61
 9:       Hallmarks. Allograft Rejection     83    82    88
10:         Hallmarks. Kras Signaling Dn     65    54    63

14.6.2 GO

# Filter data
deseq2_go_filtered_fgseaRes <- deseq2_go_fgseaRes[deseq2_go_fgseaRes$pathway %in% go_selected_pathways, ]
# Select 'pathway' and 'genecount' columns
deseq2_go_filtered_10fgseaRes <- deseq2_go_filtered_fgseaRes[, c("pathway", "genecount")]
# Print results
print(deseq2_go_filtered_10fgseaRes)
                                            pathway genecount
                                             <char>     <int>
 1:                  Epidermal Cell Differentiation       209
 2:                           Membrane Invagination        60
 3:               Regulation Of Water Loss Via Skin        18
 4:                                Skin Development       224
 5:               Alpha Beta T Cell Differentiation        43
 6: Regulation Of T Cell Receptor Signaling Pathway        19
 7:        Positive Regulation Of B Cell Activation        76
 8:                           Immunological Synapse        21
 9:                                       Desmosome        14
10:              Intermediate Filament Cytoskeleton       128
colnames(deseq2_go_filtered_10fgseaRes) <- c("pathway", "deseq2")

# Filter data
edgeR_go_filtered_fgseaRes <- edgeR_go_fgseaRes[edgeR_go_fgseaRes$pathway %in% go_selected_pathways, ]
# Select 'pathway' and 'genecount' columns
edgeR_go_filtered_10fgseaRes <- edgeR_go_filtered_fgseaRes[, c("pathway", "genecount")]
# Print results
print(edgeR_go_filtered_10fgseaRes)
                                            pathway genecount
                                             <char>     <int>
 1:                  Epidermal Cell Differentiation       204
 2:                           Membrane Invagination        58
 3:               Regulation Of Water Loss Via Skin        18
 4:                                Skin Development       216
 5:               Alpha Beta T Cell Differentiation        44
 6: Regulation Of T Cell Receptor Signaling Pathway        19
 7:        Positive Regulation Of B Cell Activation        68
 8:                           Immunological Synapse        21
 9:                                       Desmosome        14
10:              Intermediate Filament Cytoskeleton       131
colnames(edgeR_go_filtered_10fgseaRes) <- c("pathway", "edgeR")

# Filter data
limma_go_filtered_fgseaRes <- limma_go_fgseaRes[limma_go_fgseaRes$pathway %in% go_selected_pathways, ]
# Select 'pathway' and 'genecount' columns
limma_go_filtered_10fgseaRes <- limma_go_filtered_fgseaRes[, c("pathway", "genecount")]
# Print results
print(limma_go_filtered_10fgseaRes)
                                            pathway genecount
                                             <char>     <int>
 1:                  Epidermal Cell Differentiation       117
 2:                           Membrane Invagination        42
 3:               Regulation Of Water Loss Via Skin        14
 4:                                Skin Development       136
 5:               Alpha Beta T Cell Differentiation        36
 6: Regulation Of T Cell Receptor Signaling Pathway        17
 7:        Positive Regulation Of B Cell Activation        46
 8:                           Immunological Synapse        21
 9:                                       Desmosome        12
10:              Intermediate Filament Cytoskeleton        48
colnames(limma_go_filtered_10fgseaRes) <- c("pathway", "limma")

library(dplyr)
# Use full_join to merge dataframes
go_combined_df <- deseq2_go_filtered_10fgseaRes %>%
  full_join(edgeR_go_filtered_10fgseaRes, by = "pathway") %>%
  full_join(limma_go_filtered_10fgseaRes, by = "pathway")

# View the merged dataframe
print(go_combined_df)
                                            pathway deseq2 edgeR limma
                                             <char>  <int> <int> <int>
 1:                  Epidermal Cell Differentiation    209   204   117
 2:                           Membrane Invagination     60    58    42
 3:               Regulation Of Water Loss Via Skin     18    18    14
 4:                                Skin Development    224   216   136
 5:               Alpha Beta T Cell Differentiation     43    44    36
 6: Regulation Of T Cell Receptor Signaling Pathway     19    19    17
 7:        Positive Regulation Of B Cell Activation     76    68    46
 8:                           Immunological Synapse     21    21    21
 9:                                       Desmosome     14    14    12
10:              Intermediate Filament Cytoskeleton    128   131    48
# Add a prefix "GO." to the pathway column
go_combined_df <- go_combined_df %>%
  mutate(pathway = paste("GO.", pathway))

# Print the modified dataframe to view results
print(go_combined_df)
                                                pathway deseq2 edgeR limma
                                                 <char>  <int> <int> <int>
 1:                  GO. Epidermal Cell Differentiation    209   204   117
 2:                           GO. Membrane Invagination     60    58    42
 3:               GO. Regulation Of Water Loss Via Skin     18    18    14
 4:                                GO. Skin Development    224   216   136
 5:               GO. Alpha Beta T Cell Differentiation     43    44    36
 6: GO. Regulation Of T Cell Receptor Signaling Pathway     19    19    17
 7:        GO. Positive Regulation Of B Cell Activation     76    68    46
 8:                           GO. Immunological Synapse     21    21    21
 9:                                       GO. Desmosome     14    14    12
10:              GO. Intermediate Filament Cytoskeleton    128   131    48

14.6.3 KEGG

# Filter data
deseq2_kegg_filtered_fgseaRes <- deseq2_kegg_fgseaRes[deseq2_kegg_fgseaRes$pathway %in% kegg_selected_pathways, ]
# Select 'pathway' and 'genecount' columns
deseq2_kegg_filtered_10fgseaRes <- deseq2_kegg_filtered_fgseaRes[, c("pathway", "genecount")]
# Print results
print(deseq2_kegg_filtered_10fgseaRes)
                                         pathway genecount
                                          <char>     <int>
 1:                  Arachidonic Acid Metabolism        25
 2:                 Systemic Lupus Erythematosus        25
 3:                     Primary Immunodeficiency        22
 4:                           Retinol Metabolism        31
 5: Metabolism Of Xenobiotics By Cytochrome P450        37
 6:              Drug Metabolism Cytochrome P450        37
 7:          Antigen Processing And Presentation        54
 8:                     Type I Diabetes Mellitus        28
 9:                   Autoimmune Thyroid Disease        26
10:                          Allograft Rejection        27
colnames(deseq2_kegg_filtered_10fgseaRes) <- c("pathway", "deseq2")

# Filter data
edgeR_kegg_filtered_fgseaRes <- edgeR_kegg_fgseaRes[edgeR_kegg_fgseaRes$pathway %in% kegg_selected_pathways, ]
# Select 'pathway' and 'genecount' columns
edgeR_kegg_filtered_10fgseaRes <- edgeR_kegg_filtered_fgseaRes[, c("pathway", "genecount")]
# Print results
print(edgeR_kegg_filtered_10fgseaRes)
                                         pathway genecount
                                          <char>     <int>
 1:                  Arachidonic Acid Metabolism        23
 2:                 Systemic Lupus Erythematosus        27
 3:                     Primary Immunodeficiency        22
 4:                           Retinol Metabolism        30
 5: Metabolism Of Xenobiotics By Cytochrome P450        36
 6:              Drug Metabolism Cytochrome P450        36
 7:          Antigen Processing And Presentation        43
 8:                     Type I Diabetes Mellitus        27
 9:                   Autoimmune Thyroid Disease        25
10:                          Allograft Rejection        26
colnames(edgeR_kegg_filtered_10fgseaRes) <- c("pathway", "edgeR")

# Filter data
limma_kegg_filtered_fgseaRes <- limma_kegg_fgseaRes[limma_kegg_fgseaRes$pathway %in% kegg_selected_pathways, ]
# Select 'pathway' and 'genecount' columns
limma_kegg_filtered_10fgseaRes <- limma_kegg_filtered_fgseaRes[, c("pathway", "genecount")]
# Print results
print(limma_kegg_filtered_10fgseaRes)
                                         pathway genecount
                                          <char>     <int>
 1:                  Arachidonic Acid Metabolism        19
 2:                 Systemic Lupus Erythematosus        26
 3:                     Primary Immunodeficiency        16
 4:                           Retinol Metabolism        19
 5: Metabolism Of Xenobiotics By Cytochrome P450        22
 6:              Drug Metabolism Cytochrome P450        24
 7:          Antigen Processing And Presentation        35
 8:                     Type I Diabetes Mellitus        26
 9:                   Autoimmune Thyroid Disease        25
10:                          Allograft Rejection        24
colnames(limma_kegg_filtered_10fgseaRes) <- c("pathway", "limma")

library(dplyr)
# Use full_join to merge dataframes
kegg_combined_df <- deseq2_kegg_filtered_10fgseaRes %>%
  full_join(edgeR_kegg_filtered_10fgseaRes, by = "pathway") %>%
  full_join(limma_kegg_filtered_10fgseaRes, by = "pathway")

# View the merged dataframe
print(kegg_combined_df)
                                         pathway deseq2 edgeR limma
                                          <char>  <int> <int> <int>
 1:                  Arachidonic Acid Metabolism     25    23    19
 2:                 Systemic Lupus Erythematosus     25    27    26
 3:                     Primary Immunodeficiency     22    22    16
 4:                           Retinol Metabolism     31    30    19
 5: Metabolism Of Xenobiotics By Cytochrome P450     37    36    22
 6:              Drug Metabolism Cytochrome P450     37    36    24
 7:          Antigen Processing And Presentation     54    43    35
 8:                     Type I Diabetes Mellitus     28    27    26
 9:                   Autoimmune Thyroid Disease     26    25    25
10:                          Allograft Rejection     27    26    24
# Add a prefix "KEGG." to the pathway column
kegg_combined_df <- kegg_combined_df %>%
  mutate(pathway = paste("KEGG.", pathway))

# Print the modified dataframe to view results
print(kegg_combined_df)
                                               pathway deseq2 edgeR limma
                                                <char>  <int> <int> <int>
 1:                  KEGG. Arachidonic Acid Metabolism     25    23    19
 2:                 KEGG. Systemic Lupus Erythematosus     25    27    26
 3:                     KEGG. Primary Immunodeficiency     22    22    16
 4:                           KEGG. Retinol Metabolism     31    30    19
 5: KEGG. Metabolism Of Xenobiotics By Cytochrome P450     37    36    22
 6:              KEGG. Drug Metabolism Cytochrome P450     37    36    24
 7:          KEGG. Antigen Processing And Presentation     54    43    35
 8:                     KEGG. Type I Diabetes Mellitus     28    27    26
 9:                   KEGG. Autoimmune Thyroid Disease     26    25    25
10:                          KEGG. Allograft Rejection     27    26    24

14.6.4 Calculate the total number of genes

# Calculate the total number of genes across different samples/methods for the same pathway
# Add 'hallmarks_count' column to the dataframe
hallmarks_combined_count_df <- hallmarks_combined_df %>%
  mutate(hallmarks_count = rowSums(select(., deseq2, edgeR, limma), na.rm = TRUE))
hallmarks_combined_count_df <- hallmarks_combined_count_df %>%
  arrange(hallmarks_count)  # Sort in ascending order by default
print(hallmarks_combined_count_df)
                                 pathway deseq2 edgeR limma hallmarks_count
                                  <char>  <int> <int> <int>           <num>
 1: Hallmarks. Interferon Alpha Response     53    50    52             155
 2:               Hallmarks. P53 Pathway     52    52    61             165
 3:                Hallmarks. Myogenesis     56    59    62             177
 4:         Hallmarks. Kras Signaling Dn     65    54    63             182
 5:    Hallmarks. Estrogen Response Late     70    68    67             205
 6:   Hallmarks. Estrogen Response Early     71    70    74             215
 7:                Hallmarks. Complement     81    79    56             216
 8:       Hallmarks. Allograft Rejection     83    82    88             253
 9: Hallmarks. Interferon Gamma Response     99    95    86             280
10:            Hallmarks. G2m Checkpoint    113   112    70             295
# Calculate the total number of genes across different samples/methods for the same pathway
# Add 'go_count' column to the dataframe
go_combined_count_df <- go_combined_df %>%
  mutate(go_count = rowSums(select(., deseq2, edgeR, limma), na.rm = TRUE))
go_combined_count_df <- go_combined_count_df %>%
  arrange(go_count)  # Sort in ascending order by default
print(go_combined_count_df)
                                                pathway deseq2 edgeR limma
                                                 <char>  <int> <int> <int>
 1:                                       GO. Desmosome     14    14    12
 2:               GO. Regulation Of Water Loss Via Skin     18    18    14
 3: GO. Regulation Of T Cell Receptor Signaling Pathway     19    19    17
 4:                           GO. Immunological Synapse     21    21    21
 5:               GO. Alpha Beta T Cell Differentiation     43    44    36
 6:                           GO. Membrane Invagination     60    58    42
 7:        GO. Positive Regulation Of B Cell Activation     76    68    46
 8:              GO. Intermediate Filament Cytoskeleton    128   131    48
 9:                  GO. Epidermal Cell Differentiation    209   204   117
10:                                GO. Skin Development    224   216   136
    go_count
       <num>
 1:       40
 2:       50
 3:       55
 4:       63
 5:      123
 6:      160
 7:      190
 8:      307
 9:      530
10:      576
# Calculate the total number of genes across different samples/methods for the same pathway
# Add 'kegg_count' column to the dataframe
kegg_combined_count_df <- kegg_combined_df %>%
  mutate(kegg_count = rowSums(select(., deseq2, edgeR, limma), na.rm = TRUE))
kegg_combined_count_df <- kegg_combined_count_df %>%
  arrange(kegg_count)  # Sort in ascending order by default
print(kegg_combined_count_df)
                                               pathway deseq2 edgeR limma
                                                <char>  <int> <int> <int>
 1:                     KEGG. Primary Immunodeficiency     22    22    16
 2:                  KEGG. Arachidonic Acid Metabolism     25    23    19
 3:                   KEGG. Autoimmune Thyroid Disease     26    25    25
 4:                          KEGG. Allograft Rejection     27    26    24
 5:                 KEGG. Systemic Lupus Erythematosus     25    27    26
 6:                           KEGG. Retinol Metabolism     31    30    19
 7:                     KEGG. Type I Diabetes Mellitus     28    27    26
 8: KEGG. Metabolism Of Xenobiotics By Cytochrome P450     37    36    22
 9:              KEGG. Drug Metabolism Cytochrome P450     37    36    24
10:          KEGG. Antigen Processing And Presentation     54    43    35
    kegg_count
         <num>
 1:         60
 2:         67
 3:         76
 4:         77
 5:         78
 6:         80
 7:         81
 8:         95
 9:         97
10:        132

14.7 Convert to long format

# Use pivot_longer to convert from wide to long format
kegg_long_df <- kegg_combined_count_df %>%
  pivot_longer(
    cols = c(limma, deseq2, edgeR, kegg_count),
    names_to = "method/group",
    values_to = "genecount"
  )
# Print the transformed long format dataframe
print(kegg_long_df)
# A tibble: 40 × 3
   pathway                           `method/group` genecount
   <chr>                             <chr>              <dbl>
 1 KEGG. Primary Immunodeficiency    limma                 16
 2 KEGG. Primary Immunodeficiency    deseq2                22
 3 KEGG. Primary Immunodeficiency    edgeR                 22
 4 KEGG. Primary Immunodeficiency    kegg_count            60
 5 KEGG. Arachidonic Acid Metabolism limma                 19
 6 KEGG. Arachidonic Acid Metabolism deseq2                25
 7 KEGG. Arachidonic Acid Metabolism edgeR                 23
 8 KEGG. Arachidonic Acid Metabolism kegg_count            67
 9 KEGG. Autoimmune Thyroid Disease  limma                 25
10 KEGG. Autoimmune Thyroid Disease  deseq2                26
# ℹ 30 more rows
# Use pivot_longer to convert from wide to long format
go_long_df <- go_combined_count_df %>%
  pivot_longer(
    cols = c(limma, deseq2, edgeR, go_count),
    names_to = "method/group",
    values_to = "genecount"
  )
# Print the transformed long format dataframe
print(go_long_df)
# A tibble: 40 × 3
   pathway                                             `method/group` genecount
   <chr>                                               <chr>              <dbl>
 1 GO. Desmosome                                       limma                 12
 2 GO. Desmosome                                       deseq2                14
 3 GO. Desmosome                                       edgeR                 14
 4 GO. Desmosome                                       go_count              40
 5 GO. Regulation Of Water Loss Via Skin               limma                 14
 6 GO. Regulation Of Water Loss Via Skin               deseq2                18
 7 GO. Regulation Of Water Loss Via Skin               edgeR                 18
 8 GO. Regulation Of Water Loss Via Skin               go_count              50
 9 GO. Regulation Of T Cell Receptor Signaling Pathway limma                 17
10 GO. Regulation Of T Cell Receptor Signaling Pathway deseq2                19
# ℹ 30 more rows
# Use pivot_longer to convert from wide to long format
hallmarks_long_df <- hallmarks_combined_count_df %>%
  pivot_longer(
    cols = c(limma, deseq2, edgeR, hallmarks_count),
    names_to = "method/group",
    values_to = "genecount"
  )
# Print the transformed long format dataframe
print(hallmarks_long_df)
# A tibble: 40 × 3
   pathway                              `method/group`  genecount
   <chr>                                <chr>               <dbl>
 1 Hallmarks. Interferon Alpha Response limma                  52
 2 Hallmarks. Interferon Alpha Response deseq2                 53
 3 Hallmarks. Interferon Alpha Response edgeR                  50
 4 Hallmarks. Interferon Alpha Response hallmarks_count       155
 5 Hallmarks. P53 Pathway               limma                  61
 6 Hallmarks. P53 Pathway               deseq2                 52
 7 Hallmarks. P53 Pathway               edgeR                  52
 8 Hallmarks. P53 Pathway               hallmarks_count       165
 9 Hallmarks. Myogenesis                limma                  62
10 Hallmarks. Myogenesis                deseq2                 56
# ℹ 30 more rows
# Use rbind to merge these three dataframes
all_combined_df <- rbind(kegg_long_df, hallmarks_long_df, go_long_df)
# Print the merged dataframe to check the results
print(all_combined_df)
# A tibble: 120 × 3
   pathway                           `method/group` genecount
   <chr>                             <chr>              <dbl>
 1 KEGG. Primary Immunodeficiency    limma                 16
 2 KEGG. Primary Immunodeficiency    deseq2                22
 3 KEGG. Primary Immunodeficiency    edgeR                 22
 4 KEGG. Primary Immunodeficiency    kegg_count            60
 5 KEGG. Arachidonic Acid Metabolism limma                 19
 6 KEGG. Arachidonic Acid Metabolism deseq2                25
 7 KEGG. Arachidonic Acid Metabolism edgeR                 23
 8 KEGG. Arachidonic Acid Metabolism kegg_count            67
 9 KEGG. Autoimmune Thyroid Disease  limma                 25
10 KEGG. Autoimmune Thyroid Disease  deseq2                26
# ℹ 110 more rows
colnames(all_combined_df) <- c("from", "to", "value")

# Extract and deduplicate the 'from' column
unique_from <- unique(all_combined_df$from)
print("Unique 'from' values:")
[1] "Unique 'from' values:"
print(unique_from)
 [1] "KEGG. Primary Immunodeficiency"                     
 [2] "KEGG. Arachidonic Acid Metabolism"                  
 [3] "KEGG. Autoimmune Thyroid Disease"                   
 [4] "KEGG. Allograft Rejection"                          
 [5] "KEGG. Systemic Lupus Erythematosus"                 
 [6] "KEGG. Retinol Metabolism"                           
 [7] "KEGG. Type I Diabetes Mellitus"                     
 [8] "KEGG. Metabolism Of Xenobiotics By Cytochrome P450" 
 [9] "KEGG. Drug Metabolism Cytochrome P450"              
[10] "KEGG. Antigen Processing And Presentation"          
[11] "Hallmarks. Interferon Alpha Response"               
[12] "Hallmarks. P53 Pathway"                             
[13] "Hallmarks. Myogenesis"                              
[14] "Hallmarks. Kras Signaling Dn"                       
[15] "Hallmarks. Estrogen Response Late"                  
[16] "Hallmarks. Estrogen Response Early"                 
[17] "Hallmarks. Complement"                              
[18] "Hallmarks. Allograft Rejection"                     
[19] "Hallmarks. Interferon Gamma Response"               
[20] "Hallmarks. G2m Checkpoint"                          
[21] "GO. Desmosome"                                      
[22] "GO. Regulation Of Water Loss Via Skin"              
[23] "GO. Regulation Of T Cell Receptor Signaling Pathway"
[24] "GO. Immunological Synapse"                          
[25] "GO. Alpha Beta T Cell Differentiation"              
[26] "GO. Membrane Invagination"                          
[27] "GO. Positive Regulation Of B Cell Activation"       
[28] "GO. Intermediate Filament Cytoskeleton"             
[29] "GO. Epidermal Cell Differentiation"                 
[30] "GO. Skin Development"                               
# Extract and deduplicate the 'to' column
unique_to <- unique(all_combined_df$to)
print("Unique 'to' values:")
[1] "Unique 'to' values:"
print(unique_to)
[1] "limma"           "deseq2"          "edgeR"           "kegg_count"     
[5] "hallmarks_count" "go_count"       

14.8 Enrichment Circlize

14.8.1 prepare data

original_colors <- c(
  `KEGG. Primary Immunodeficiency` = "#0d47a1",
  `KEGG. Arachidonic Acid Metabolism` = "#2058ab",
  `KEGG. Autoimmune Thyroid Disease` = "#3469b5",
  `KEGG. Allograft Rejection` = "#4779bf",
  `KEGG. Systemic Lupus Erythematosus` = "#5a8ac9",
  `KEGG. Retinol Metabolism` = "#6e9bd3",
  `KEGG. Type I Diabetes Mellitus` = "#81acdd",
  `KEGG. Metabolism Of Xenobiotics By Cytochrome P450` = "#94bce7",
  `KEGG. Drug Metabolism Cytochrome P450` = "#a8cdf1",
  `KEGG. Antigen Processing And Presentation` = "#bbdefb",
  `Hallmarks. Interferon Alpha Response` = "#1b5e20",
  `Hallmarks. P53 Pathway` = "#2e6d33",
  `Hallmarks. Myogenesis` = "#417c46",
  `Hallmarks. Kras Signaling Dn` = "#558b58",
  `Hallmarks. Estrogen Response Late` = "#689a6b",
  `Hallmarks. Estrogen Response Early` = "#7baa7e",
  `Hallmarks. Complement` = "#8eb991",
  `Hallmarks. Allograft Rejection` = "#a2c8a3",
  `Hallmarks. Interferon Gamma Response` = "#b5d7b6",
  `Hallmarks. G2m Checkpoint` = "#c8e6c9",
  `GO. Desmosome` = "#ff6f00",
  `GO. Regulation Of Water Loss Via Skin` = "#ff7d14",
  `GO. Regulation Of T Cell Receptor Signaling Pathway` = "#ff8b28",
  `GO. Immunological Synapse` = "#ff993c",
  `GO. Alpha Beta T Cell Differentiation` = "#ffa750",
  `GO. Membrane Invagination` = "#ffb463",
  `GO. Positive Regulation Of B Cell Activation` = "#ffc277",
  `GO. Intermediate Filament Cytoskeleton` = "#ffd08b",
  `GO. Epidermal Cell Differentiation` = "#ffde9f",
  `GO. Skin Development` = "#ffecb3",
  `limma` = "#ab47bc",
  `deseq2` = "#7e57c2",
  `edgeR` = "#3f51b5",
  `kegg_count` = "#4979bb",
  `hallmarks_count` = "#6a9a6f",
  `go_count` = "#fda85d"
)
labels <- c(
  "KEGG. Primary Immunodeficiency",                     
  "KEGG. Arachidonic Acid Metabolism",                  
  "KEGG. Autoimmune Thyroid Disease",                   
  "KEGG. Allograft Rejection",                          
  "KEGG. Systemic Lupus Erythematosus",                 
  "KEGG. Retinol Metabolism",                           
  "KEGG. Type I Diabetes Mellitus",                     
  "KEGG. Metabolism Of Xenobiotics By Cytochrome P450", 
  "KEGG. Drug Metabolism Cytochrome P450",              
  "KEGG. Antigen Processing And Presentation",          
  "Hallmarks. Interferon Alpha Response",               
  "Hallmarks. P53 Pathway",                             
  "Hallmarks. Myogenesis",                              
  "Hallmarks. Kras Signaling Dn",                       
  "Hallmarks. Estrogen Response Late",                  
  "Hallmarks. Estrogen Response Early",                 
  "Hallmarks. Complement",                              
  "Hallmarks. Allograft Rejection",                     
  "Hallmarks. Interferon Gamma Response",               
  "Hallmarks. G2m Checkpoint",                          
  "GO. Desmosome",                                      
  "GO. Regulation Of Water Loss Via Skin",              
  "GO. Regulation Of T Cell Receptor Signaling Pathway",
  "GO. Immunological Synapse",                          
  "GO. Alpha Beta T Cell Differentiation",              
  "GO. Membrane Invagination",                         
  "GO. Positive Regulation Of B Cell Activation",       
  "GO. Intermediate Filament Cytoskeleton",             
  "GO. Epidermal Cell Differentiation",                 
  "GO. Skin Development"                  
)

# 定义颜色
colors <- c(
  "#0d47a1",
  "#2058ab",
  "#3469b5",
  "#4779bf",
  "#5a8ac9",
  "#6e9bd3",
  "#81acdd",
  "#94bce7",
  "#a8cdf1",
  "#bbdefb",
  "#1b5e20",
  "#2e6d33",
  "#417c46",
  "#558b58",
  "#689a6b",
  "#7baa7e",
  "#8eb991",
  "#a2c8a3",
  "#b5d7b6",
  "#c8e6c9",
  "#ff6f00",
  "#ff7d14",
  "#ff8b28",
  "#ff993c",
  "#ffa750",
  "#ffb463",
  "#ffc277",
  "#ffd08b",
  "#ffde9f",
  "#ffecb3"
)
labels2 <- c("limma",
            "deseq2",
            "edgeR",
            "kegg_count",
            "hallmarks_count",
            "go_count")
colors2 <- c("#ab47bc",
            "#7e57c2",
            "#3f51b5",
            "#4979bb",
            "#6a9a6f",
            "#fda85d")
enrichment_circlize(all_combined_df, original_colors, labels, colors, labels2, colors2, font_size = 10)

14.9 Reference

  • ggplot2:

github:ggplot2

An implementation of the Grammar of Graphics in R

  • GSVA:

GSVA: gene set variation analysis for microarray and RNA-seq data

  • fgsea:

fgsea is an R-package for fast preranked gene set enrichment analysis (GSEA).

  • clusterProfiler 4.0:

T Wu#, E Hu#, S Xu, M Chen, P Guo, Z Dai, T Feng, L Zhou, W Tang, L Zhan, X Fu, S Liu, X Bo, G Yu. clusterProfiler 4.0: A universal enrichment tool for interpreting omics data. The Innovation. 2021, 2(3):100141.

  • circlize:

Zuguang Gu, et al., circlize Implements and enhances circular visualization in R. Bioinformatics (Oxford, England) 2014.